Visualizing terraform apply in Real-Time
Many many years ago, before the more stable days of Terraform v1.0+, consumers of the tool had to be intimately familiar with its underlying behaviors. I certainly modified production tfstate manually more times than I care to admit. At the heart of plans/applies lives the dependency graph. The dependency graph determines the execution order for state changes and ensures that prerequisites are met before dependent resources are touched. It's what enables concurrency and guarantees configurations are acyclic. If you're unfamiliar, here's the command:
terraform graph | dot -Tpng > graph.png
Drawn using graphviz, the result looks like this (arrows point to resource dependencies)...
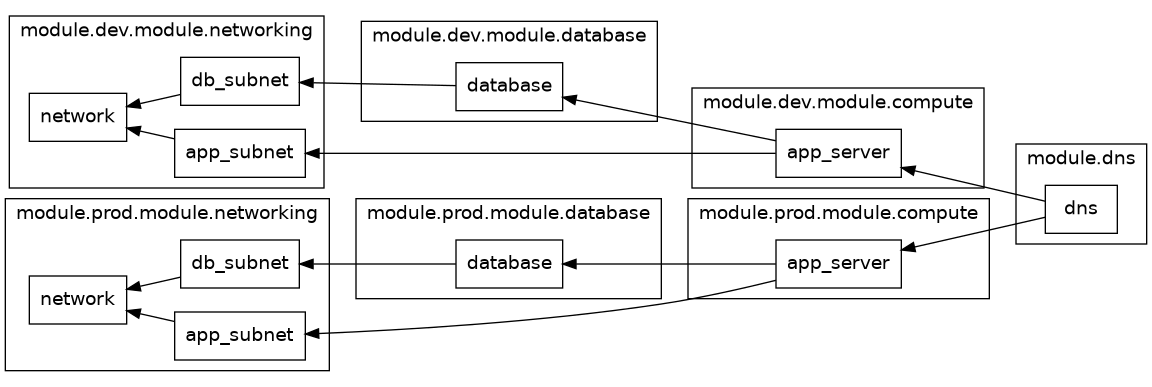
Over time, Terraform improved to the point where the average user could take those little things for granted. We got new features like module and for_each which changed how we organized our code. Wrappers like Terragrunt eliminated boilerplate configuration and kept us DRY. Platforms like Terraform Cloud and Spacelift gave us a centralized control plane. Hyperscaler APIs became more durable. With each improvement, those fundamental ideas begin to get abstracted away from the user.
Fast-forward to this year, I was doing some OpenTelemetry integration when I had an idea. Could I stream and retain the low-level terraform apply events and use them for deeper analysis? As I was playing around with the --json streams, a different approach presented itself.
The JSON Stream
Running terraform apply normally gives you this sort of information:
module.prod.module.networking.aws_vpc.network: Creation complete after 9s [id=88b395fe-651d-aff5-bd83-93802acec566]
module.prod.module.networking.aws_subnet.app_subnet: Creating...
module.prod.module.networking.aws_subnet.db_subnet: Creating...
If you append the -json flag instead, every line becomes a full object:
{
  "@timestamp": "2026-06-18T01:24:12.338141Z",
  "@message": "module.prod.module.networking.aws_vpc.network: Creation complete after 9s [id=88b395fe-651d-aff5-bd83-93802acec566",
  "hook": {
    "resource": {"addr": "module.prod.module.networking.terraform_data.network"},
    "action": "create",
    "id_value": "88b395fe-651d-aff5-bd83-93802acec566",
    "elapsed_seconds": 9
  },
  "type": "apply_complete"
}
There are quite a few elements here that we can use:
@timestamp- when this event occurred@message- the normal CLI output contenthook.resource.addr- the address of the resource being acted uponhook.action- the type of action (e.g.,create,update,delete)hook.elapsed_seconds- how long the action has been underwaytype- the classification for this event (e.g.,apply_progressorapply_complete)
The full documentation for these outputs can be found here.
The Dependency Graph
As mentioned above, the dependency graph is at the heart of all terraform plans, applies, and destroys. Let's look at what terraform graph actually generates.
"module.prod.module.networking.aws_subnet.app_subnet" -> "module.prod.module.networking.aws_vpc.network";
"module.prod.module.database.aws_instance.database" -> "module.prod.module.networking.aws_subnet.db_subnet";
"module.dns.aws_route53_record.dns" -> "module.prod.module.compute.aws_instance.app_server";
The beautiful thing here is that the DOT resource addresses already match what was shown in the --json stream. That will make our lives a lot easier moving forward.
Wiring It Up
If we have a tool that can draw the DOT graph output and subscribe to the JSON event stream, it would be trivial to watch the apply in real-time rather than follow the CLI outputs. At any given point, it'd be obvious to the viewer what resources are completed, what updates are still happening, and what lies downstream.

There's a slightly more useful version of this that isn't a party trick. Imagine the following components:
- Terraform wrapper: on every
applyordestroy, open a new session with the server, generate and pass the DOT file, and emit the JSON events - Server: manages sessions and forwards event streams to subscribers
- Dashboard: shows subscribers every in-flight apply and draws the events
In an enterprise utilizing hundreds of CI runners churning through applies all day, "which apply is hung, and on which resource" is a real question without a great solution. It's even worse if you want to query that information after the fact. The underlying data in these streams should certainly be used for more than just visuals. For example, anomaly detection (why does this resource get updated every day?) and cost analysis (runners can get expensive!) would both be quick wins.
Conclusion
Watching Terraform execution visually might not be high on your DevOps wish list. It's not on mine either. The part worth keeping is the realization underneath it: terraform apply -json is a stable, documented, already-shipping event stream, and few people look at it because the default CLI output is good enough to watch, just not good enough to keep.
For an actual wrapper/server/dashboard PoC, check out my GitHub.
Disclosure: graph components were built with AI coding assistance